A Tale of Two Coventry Property Markets and the Need for Realistic Pricing
The Coventry property market has undergone significant changes over the past few years, as depicted in the two graphs provided. These visualisations capture the trends in the number of properties available for sale and the number of properties sold subject to contract (SSTC) from January 2019 to July 2024. By analysing these graphs, we can gain insight into the evolving dynamics of the local property market and the necessity for Coventry homeowners to adopt realistic pricing strategies, especially given the increase of available homes since mid-2022.
A Closer Look at the Coventry Market Dynamics (2019-2024)
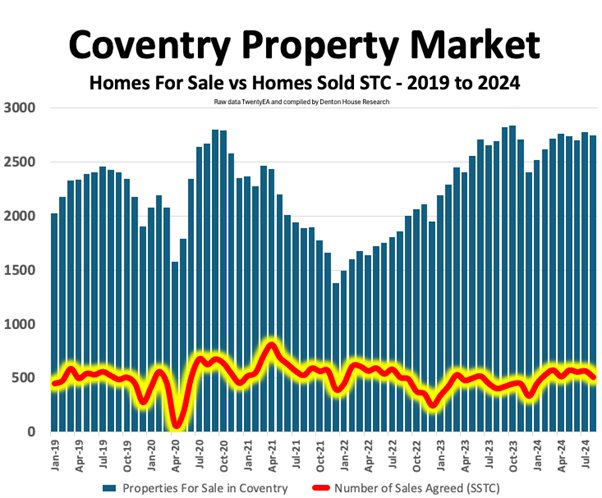
From January 2019 to February 2020 (a normal market), the number of properties for sale in Coventry remained relatively stable, at an average of 2,261 homes (Coventry being CV1-CV7). This pre-COVID period also showed a steady number of properties being sold each month, with an average of 488 home sales. This indicates a balanced market where the supply of homes was more or less matched by buyer demand.
The Coventry property market underwent a noticeable shift with the onset of the COVID-19 pandemic in late March 2020. As the pandemic gripped the nation, the number of properties that sold in April and May 2020 plummeted sharply. This was due to the uncertainty brought about by the pandemic, with many potential buyers holding off buying a home amidst the economic uncertainty.
However, the floodgates opened once the property market lockdown was lifted in May/June 2020. The number of properties coming onto the market in June/July/August 2020 in the UK rose by 27.1% above long-term averages for the time of year, yet the number of homes selling also rose.
In Coventry, in the 20 months between May 2020 and December 2021, the average number of Coventry homes selling was 589 per month (one month, it even hit the heady heights of 808 homes sold stc). Yet, the number of homes for sale steadily dropped throughout that period to an all-time low of just 1,379 homes for sale in December 2021.
What stands out during this period is that despite the reduced number of Coventry properties for sale, the number of properties sold remained robust. This surge in demand, despite a drop in available Coventry homes, can be attributed to the combination of pent-up demand and the government's intervention in the property market, mainly the stamp duty holiday, which incentivised buyers to move quickly.
As the dust started to settle from 2021 and as we moved into the first half of 2022, the property market started to feel like it was coming back to a ‘normal property market’ as the number of homes selling settled down and the general level of properties for sale also steadily began to rise.
However, just as we returned from our summer holidays in 2022, the Coventry property market was badly hit twice in a 12-month window.
The first hit was the Truss Budget in late 2022. In the five months following that budget, the average number of Coventry home sales dropped to an average of only 347 sales per month. It started to recover in the spring of 2023, as home sales rose to an average of 497 sales per month, only to be hit again when the increasing interest rates started to bite in the summer of 2023. Home sales in Coventry dropped to only 423 sales per month in the summer months of 2023.
Number of Coventry Homes for Sale Surge After January 2024
Since January 2024, the number of Coventry homes selling has been at an average of 532 homes sales per month, yet here is a fly in the ointment: the number of homes for sale has steadily risen to 2,748 in August 2024 alone.
This significant increase in supply could be due to various factors, including homeowners taking advantage of high property prices, an increase in new builds, or a growing number of properties that failed to sell in previous months being relisted.
Percentage Proportions: Coventry vs. UK Trends
The second graph, set against a black background, delves deeper into this dynamic by comparing the same set of numbers against each other and expressing them as a percentage.
By doing that, we can analyse the proportion of monthly homes sold relative to the number of properties available.
The yellow line on the graph represents the percentage of Coventry properties sold SSTC during the month as a proportion of the homes for sale, while the red line for interest shows the equivalent figure for the entire UK.
This graph reveals quite telling information. Throughout 2020, 2021, and early 2022, the proportion of homes sold in Coventry (yellow line) spiked into the mid-high 30%. This aligns with the earlier observation that, despite fewer homes being available, a higher percentage of these homes were being snapped up by eager buyers following the pandemic.
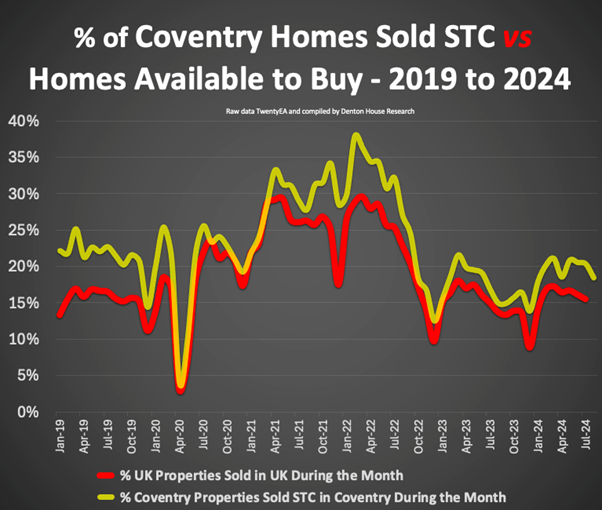
However, as we moved further into 2022 and beyond, this trend began to reverse. The proportion of homes sold (as a percentage of the homes for sale) in Coventry started to decline, and now the figure now stands around the high-teens.
What does it all mean for Coventry home movers?
The stable number of home sales against a backdrop of increasing supply could signal a potential issue: the market may be approaching a tipping point where supply begins to outstrip demand.
Given these trends, it’s clear that Coventry homeowners looking to sell their properties need to be mindful of the market dynamics. With the number of homes for sale having increased since mid-2022, competition among sellers is fiercer than in recent years. While buyer demand remains strong, it has not increased at the same rate as the supply of Coventry homes on the market, which could lead to longer times on the market and, potentially, downward pressure on prices.
In such a market, pricing becomes crucial. Coventry homeowners who are serious about selling need to ensure their properties are competitively priced to attract buyers.
Overpricing in a market with abundant choices could result in Coventry properties languishing unsold for extended periods. On the other hand, a realistic and attractive price point could make all the difference in securing a swift sale.
Also, remember that the longer a home takes to sell, the greater the chance the sale will fall through even when the sale is agreed upon. Looking at an examination from Denton House Research using data from TwentyEA, they noted that if a UK home sold within 25 days of the property coming on the market, the homeowners had a 94% chance of getting the sale through to completion (i.e. moving) with only a 6% chance of the sale falling through. If, however, the sale was agreed upon in more than 100 days, the chances of actually completing that sale and moving reduced vastly to only 56%, with a 44% chance of the sale falling through.
In conclusion, while the Coventry property market remains active, available homes have increased since mid-2022, this has introduced a new challenge for sellers. To achieve a successful sale, Coventry homeowners must pay close attention to market trends and set their prices accordingly. Realistic pricing and an understanding of the broader market dynamics will be vital in navigating this evolving landscape. As the data suggests, the market is still healthy, but the balance between supply and demand is shifting, making strategic pricing more critical than ever.